- Concepts
- demographysocietymigrationtourismStrang eraIrish eraModern era
- Within
- Beaver Island
Summary
Beaver Island’s population has moved through three orders of magnitude in 170 years, but the evidence remains uneven. Strang’s kingdom claimed roughly 2,600 residents in the mid-1850s — from Strang’s own newspaper. Published Census tables now supply island totals of 792 (1900), 1,065 (1910), 779 (1920), 527 (1930), 521 (1940), 396 (1950), 217 (1960), 219 (1970), 321 (1980), and 404 (1990);1 the Census county-subdivision series then reads 551 (2000), 657 (2010), 525 (2020).2 The printed extract is still partial, and its 1890 Peaine row is not comparable because St. James was subsequently organized from Peaine territory.
Since 1970 the island’s houses have been counted too, and they tell the other half of the story: 298 dwellings in 1970, 455 in 1980, 667 in 1990, 741 in 2000, 1,016 in 2010 and 944 in 2020.34 In every year both have been counted there have been more dwellings than residents, and in 2020 there were 944 dwellings for 525 people — 598 of them empty because they are seasonal.
The island today is old and mostly empty of people for most of the year. The 2019-2023 ACS puts the median age at 66.1 in Peaine and 59.5 in St. James, and finds 578 of 966 housing units vacant — about 60%, dominated by seasonal homes.5 A place with 525 usual residents and 944 dwellings is not depopulating so much as it has become somewhere people are from and come back to.
A May 1972 local obituary supplies a qualitative bridge between the historical and modern series. It remembers Lloyd McDonough’s lifetime on the island as a period in which fishing and farming gave way to population loss, mainland work, and then tourism as the main economy. That is a community retrospective, not a replacement for a population count or an independently dated economic series.
Which number is which
One trap governs the whole article. The 2020 decennial count of 525 and the ACS 2019-2023 estimate of 752 are not in conflict. They measure different things:
| Measure | Value | What it is |
|---|---|---|
| Decennial census 2020 | 525 | A count of usual residents on 1 April 2020 |
| ACS 2019-2023 5-year | 752 | A model-based rolling estimate over five years, with wide margins on a population this small |
| Decennial housing units 2020 | 944 | Dwellings counted on the same day, occupied or not |
| Decennial vacant units 2020 | 668 (71%) | Of which 598 vacant for seasonal, recreational or occasional use |
| Decennial occupied units 2020 | 276 | Households — the number of dwellings anybody lived in |
| ACS housing units | 966 | The estimate of the same thing, not the count |
| Winter counts, 1957–1965 | 170–210 | What a local newspaper found in January, which no census measures |
Never present any of these as “the population of Beaver Island” without saying which it is. Small-area ACS estimates for a place of this size carry margins of error large enough to swamp the differences between census years, and the decennial count and the ACS estimate must never be compared as though they were points on one line.
The two townships — St. James in the north and Peaine in the south — together cover Beaver Island and no mainland, so their sum is the island’s population. That makes the county-subdivision geography exactly right, and it is why the series exists at all.
The Strang-era claim
Quaife, writing in 1930 with the Strangite records in hand, reaches his figure this way:
A census taken in the autumn of 1854 disclosed 2,608 residents on Big Beaver Island. There was undoubtedly a considerable increase during the year 1855, and the gentile population of the island was but a handful. … we arrive at the conclusion that approximately 2,600 people were driven from the island following the shooting of Strang.6
His footnote for the 2,608 is Northern Islander, 2 November 1854 — Strang’s own paper, so the figure is recorded here as contested. Elsewhere Quaife puts “the Mormon population of the islands and the adjoining mainland” at the 1856 dispersion “in excess of 2,500”, again on Strangite evidence.
Two things support the order of magnitude without confirming the figure. Quaife notes a contemporary letter recording that 490 people were taken to Chicago on a single boat after the expulsion, with 300 more having already left on the Iowa and the Louisville carrying “all she could stow” to Detroit.6 And Strang’s paper, on 9 January 1851, reports the federal census of 1 June 1850 for Mackinac County — “including the unorganized counties attached” — as 3,598 while asserting that “the single township of Peaine contains 300 inhabitants more at the present time, than the Marshal’s returns”7 — an admission, in the kingdom’s own voice, that its numbers and the government’s did not agree.
An honest statement is therefore: the island’s population in the mid-1850s was probably in the low thousands, on evidence produced by the party with the strongest interest in it being large, and no independent enumeration survives in anything held here.
Who was not counted
The 1850 census figure Strang reprints carries the qualification “This is exclusive of Indians.”7 That is not an aside. Strang’s own gazetteer of the same period puts about two hundred people on Garden Island and about two thousand across the five Indian villages of Emmet County. None of them are in the federal number.
Any population series for this archipelago that begins from census returns therefore begins by omitting its longest-resident population. See Anishinaabe presence in the archipelago.
A partial long series
The held record does not yet provide every decennial year, but it no longer leaves the whole twentieth century blank. Published federal tables give 1900 as 372 in Peaine plus 420 in St. James (792); 1910 as 370 plus 695 (1,065); 1920 as 243 plus 536 (779); 1930 as 170 plus 357 (527); 1940 as 175 plus 346 (521); and 1950 as 99 plus 297 (396). The later tables give 48 plus 169 (217) in 1960; 58 plus 161 (219) in 1970; 81 plus 240 (321) in 1980; and 128 plus 276 (404) in 1990.1 The 1900 publication also prints Peaine as 426 in 1890, but notes that St. James was organized from part of Peaine after 1890. That row is a useful boundary-history warning, not a valid island total.
The direct 1920 table corroborates Quaife’s footnote that “the census of 1920 showed a total of 779 residents in the two townships into which the island is divided.”6 Do not use the discontinuous table points to infer an unbroken annual trend from Strang’s partisan mid-1850s estimate.
The narrative around it is well attested even where the numbers are not. The Irish settlement that followed the Strangites was built on fishing (see Commercial fishing); the lumber industry added population briefly in the early 1900s and its end date is disputed (1915, 1916 or 1917; see Lumbering); the fishery collapsed in the early-to-mid 20th century. The outer islands emptied: a later regional-guidebook tradition places the last permanent Garden Island resident, Pete Manatou, in the 1940s, and High Island’s community dispersed after the November 1940 storm. Both claims need primary corroboration. Beaver Island became the only inhabited island in the archipelago. The 2023 Master Plan describes the island as having “struggled to maintain population until the 1970s, when tourism emerged as the economic anchor of the community.”
The modern series
| Year | St. James | Peaine | Island total | Dwellings |
|---|---|---|---|---|
| 1900 | 420 | 372 | 792 | — |
| 1910 | 695 | 370 | 1,065 | — |
| 1920 | 536 | 243 | 779 | — |
| 1930 | 357 | 170 | 527 | — |
| 1940 | 346 | 175 | 521 | — |
| 1950 | 297 | 99 | 396 | — |
| 1960 | 169 | 48 | 217 | — |
| 1970 | 161 | 58 | 219 | 298 |
| 1980 | 240 | 81 | 321 | 455 |
| 1990 | 276 | 128 | 404 | 667 |
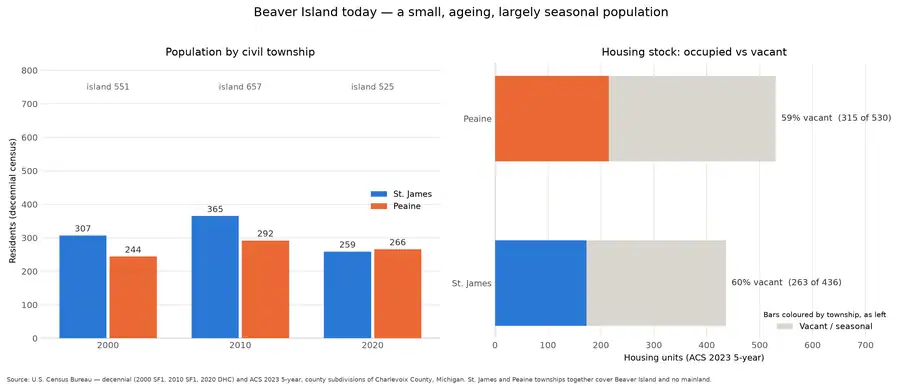
| 2000 | 307 | 244 | 551 | 741 |
| 2010 | 365 | 292 | 657 | 1,016 |
| 2020 | 259 | 266 | 525 | 944 |
The population column for 1900–1990 comes from published minor-civil-division and county-subdivision tables, and the island totals in it are transparent sums of the two township rows rather than a separately published Census geography.13 The 2000–2020 rows come from the decennial tables for the same two county subdivisions.24
The population column is a count of people; the dwelling column is a count of Census housing units on the same day. They are not two views of one quantity and the table does not treat them as one, but they are both counts of things on the same ground at the same dates, which is what makes the divergence readable at all. The dwelling column is empty before 1970 because no published federal table reaches these townships earlier, not because the houses were not there.
One crossing in that table is worth naming. St. James held more people than Peaine in every year from 1900 through 2010 — by more than three to one in 1960, and still by 73 people in 2010. In 2020 that order reversed for the first time in the recorded series: Peaine 266, St. James 259. The margin was seven people, which at this scale is well inside what a handful of households can move, and this article previously left it there as a first occurrence rather than a direction. The annual estimates below now let that be revisited.
The annual estimates, 2018–2025
Between the decennial counts the Census Bureau publishes modeled July 1 estimates for the same two county subdivisions:
| Year | St. James | Peaine | Island total |
|---|---|---|---|
| 2018 | 278 | 275 | 553 |
| 2019 | 267 | 273 | 540 |
| 2020 | 258 | 269 | 527 |
| 2021 | 259 | 270 | 529 |
| 2022 | 258 | 269 | 527 |
| 2023 | 257 | 269 | 526 |
| 2024 | 257 | 269 | 526 |
| 2025 | 257 | 267 | 524 |
The reversal has held. Peaine has been estimated larger than St. James in every year from 2019 to 2025 — seven consecutive years, and in both of the two independent series spliced here. That is no longer a single crossing at one decennial date. It is not a large gap, and the estimates are not counts, but a one-off has become a persistent ordering.
The eight years are otherwise remarkably flat. From 2020 the island total moves 527, 529, 527, 526, 526, 524 — a drift of five people across six years, on a base of about 525. Peaine is estimated at 269 in four separate years.
That flatness should be read carefully, and not as evidence that nothing happened. These are modeled values for units of a few hundred people; a real annual change of one or two residents is smaller than the method can resolve, so a flat line here is as consistent with churn that nets out as with stillness.
Three limits belong with the table:
- They are estimates, not counts. The Population Estimates Program models these values, and no margins of error are published for them — so unlike the ACS figures above, there is no interval to reason with.
- Two vintages are spliced. 2018–2019 come from the revised 2010–2020 intercensal file; 2020–2025 from Vintage 2025. Comparisons within either run are like-for-like; a comparison across 2019–2020 crosses a change of method as well as a change of year.
- The 2020 row is not the 2020 census. The estimate for that year — Peaine 269, St. James 258, total 527 — differs from the decennial count of 266, 259 and 525. The reference dates differ (July 1 against April 1) and so does the method. Both are in this article on purpose; neither is a correction of the other.
Three modern points is not a trend, and the 2010 peak is the kind of movement that a handful of households can produce at this scale. What is more robust is the composition. From the 2019-2023 ACS:
| St. James | Peaine | |
|---|---|---|
| Population (ACS estimate) | 374 | 378 |
| Median age | 59.5 | 66.1 |
| Housing units | 436 | 530 |
| Vacant units | 263 | 315 |
| Of those, vacant for seasonal or occasional use | 242 | 301 |
| Occupied units (households) | 173 | 215 |
| Owner-occupied | 152 | 210 |
| Renter-occupied | 21 | 5 |
| Median household income | $66,806 | $75,625 |
| Median home value | $286,400 | $348,500 |
All of the figures in that table are ACS 5-year estimates for the two county subdivisions, not counts.5
A median age of 66.1 means more than half of Peaine’s residents are of retirement age, and the two townships differ from each other about as much as either differs from the state. Peaine, the southern and less built-up township, is older, has more housing, more vacancy, higher incomes and higher home values than St. James, which contains the village and the harbour. That pattern is consistent with Peaine being disproportionately seasonal and St. James disproportionately year-round, but the ACS margins at this size do not let the difference be asserted firmly.
Houses without people
The dwelling series is the most useful demographic measure available after the population count itself, and it is a recent addition to the record — published federal tables reach these townships only from 1970.
| Census | Housing units | Occupied | Vacant | Vacant, seasonal | Residents |
|---|---|---|---|---|---|
| 1970 | 298 | — | — | — | 219 |
| 1980 | 455 | — | — | — | 321 |
| 1990 | 667 | — | — | — | 404 |
| 2000 | 741 | 258 | 483 | 463 | 551 |
| 2010 | 1,016 | 336 | 680 | 610 | 657 |
| 2020 | 944 | 276 | 668 | 598 | 525 |
Occupancy and seasonal-vacancy detail exists only from 2000; the 1970–1990 rows carry a housing-unit total and nothing else.34
Three things in that table are worth stating carefully.
The dwellings tripled while the population did not. Between 1970 and 2010 the island’s housing stock went from 298 units to 1,016 — a 3.4-fold increase — while its counted population went from 219 to 657. Population growth of that proportion sounds comparable until you notice that only 336 of the 1,016 dwellings had anybody living in them.
Almost every vacant dwelling is a seasonal one. In 2020, 598 of the 668 vacant units were vacant for seasonal, recreational or occasional use — 89% of the vacancy, and 63% of every dwelling on the island. This is not a place with abandoned houses. It is a place whose houses are mostly used in summer.
The 2010–2020 decline of 72 units is not 72 houses lost. At this scale, a change in whether a derelict cabin or a structure mid-renovation is classified as a housing unit at all moves the total more than building does. Treat the 1,016 as a peak in the published series, not as a demolition record.
The island total also hides a split between the two townships. In 1970 each reported exactly 149 units — a coincidence the published series flags as such, not a boundary artefact. They have diverged in every count since.
| Census | Peaine | St. James | Island |
|---|---|---|---|
| 1970 | 149 | 149 | 298 |
| 1980 | 231 | 224 | 455 |
| 1990 | 344 | 323 | 667 |
| 2000 | 410 | 331 | 741 |
| 2010 | 564 | 452 | 1,016 |
| 2020 | 529 | 415 | 944 |
Peaine has held the larger housing stock in every year since 1980 and, until 2020, the smaller population. That combination is what the composition table above reads as Peaine being disproportionately seasonal; the decennial counts establish the pattern but not its cause.34
The consequence is the island’s standing housing problem, which its own institutions have been studying: the 2023 Beaver Island Housing Market Analysis, 2023 examines demand for affordable rental, workforce and market-rate housing for permanent residents, and says explicitly that second and vacation homes are outside its scope. A place can have 944 dwellings, 668 of them empty on census day, and still have nowhere for a year-round worker to live.
The winter number
The census asks where people usually live on 1 April. On Beaver Island that answer and the answer to “who is here now” have never been the same, and the gap is the thing residents themselves have always counted.
The Beaver Beacon published its own January counts:
| January | Reported | Source |
|---|---|---|
| 1957 | ≈ 210 | Beaver Island’s reported winter population reaches approximately 210, 1957 |
| 1962 | 202, in 55 households | Beaver Island winter census reported by the Beacon, 1962 |
| 1965 | 170 | Beaver Island winter departures reduce the reported population to 170, 1965 |
These sit below the decennial counts that bracket them — 217 in 1960 and 219 in 1970 — which is roughly what one would expect if the census and the winter were measuring nearly the same small community in that period. They are not independent verification of the census: the 1962 figure is a newspaper’s own enumeration, offered in explicit disagreement with a 166 figure attributed to the Grand Rapids Press, and none of the three states its method.
What the winter counts establish is that the island was already keeping two numbers about itself in the 1950s and 1960s. Nothing held here measures the summer number in any period. The 598 seasonal dwellings of 2020 imply a summer population several times the winter one, but an implication is not a measurement; ferry and air passenger counts would be.
Open questions
- The missing decades are now the nineteenth-century ones. Every decennial year from 1900 to 2020 is held from a published table. What is still blank is 1850–1890: the federal schedules exist but are not held here, and the Michigan state-census years identified for follow-up — 1864, 1874, 1884 and 1894 — would bracket the collapse after 1856 that no held source measures at all.
- Dwellings before 1970. The published federal record of houses on this island starts in 1970 because these townships were below the small-area threshold of the 1950 and 1960 Censuses of Housing. Township assessment rolls or the manuscript census schedules, which record dwellings household by household, would push the dwelling series back a century.
- Is there any independent count of the Strangite population? Everything traces back to the Northern Islander. A Michigan state census, a county assessment roll or a church membership record would break the circularity.
- 1856 itself. Quaife’s ~2,600 expelled is a reconstruction from a claimed 1854 base plus assumptions. Passenger lists or vessel manifests for the summer of 1856 would test it.
- The outer islands. No population figures at all are held for Garden, High or Hog Islands in any period, despite Strang’s ~200 for Garden Island in 1854 and the existence of Garden Island Township (1859) and Chandler Township (1861).
- Seasonal population. 598 seasonal dwellings imply a summer population several times the resident one, but nothing held here estimates it. Ferry and air passenger counts would.
- Ancestry and origin. The Arranmore-dominated Irish settlement is central to the island’s identity but is not measured in anything held here; ACS ancestry tables at this geography would carry very large margins.
See also
- Township of Saint James
- Township of Peaine
- Historical Census township population extracts for Beaver Island, 1890–1990
- Census township population series for Beaver Island, 2000–2020
- Historical Census township housing-unit counts for Beaver Island, 1970–1990
- Census township housing series for Beaver Island, 2000–2020
- Irish settlement of Beaver Island
- Kingdom of Saint James
- Commercial fishing
- Lumbering
- Anishinaabe presence in the archipelago
- Historiography
Footnotes
-
U.S. Census Bureau published Michigan minor-civil-division and county-subdivision tables for 1900, 1910, 1920, 1930, 1940, 1950, 1960, 1970, 1980 and 1990, normalised into a township series held here. Rows labelled “ISLAND TOTAL” are sums of the Peaine and St. James rows in the same published table. The 1890 Peaine row of 426 is marked not comparable in that series because St. James was organised out of Peaine after 1890. ↩ ↩2 ↩3
-
U.S. Census Bureau, decennial censuses of 2000 (SF1), 2010 (SF1) and 2020 (DHC), county subdivisions of Charlevoix County, Michigan. ↩ ↩2
-
U.S. Census Bureau, 1990 Census of Population and Housing: Population and Housing Unit Counts, Michigan (CPH-2-24), housing-unit counts for 1970, 1980 and 1990. The two townships coincidentally report the same 1970 figure of 149 units each. ↩ ↩2 ↩3 ↩4
-
U.S. Census Bureau, decennial censuses of 2000, 2010 and 2020, housing-unit, occupancy and seasonal-vacancy counts for the same two county subdivisions. ↩ ↩2 ↩3 ↩4
-
U.S. Census Bureau, American Community Survey 5-Year Estimates 2019-2023, county subdivisions of Charlevoix County, Michigan. Peaine: 378 people, 530 units, 215 occupied, 315 vacant, 301 seasonal, median age 66.1. St. James: 374 people, 436 units, 173 occupied, 263 vacant, 242 seasonal, median age 59.5. ↩ ↩2
-
Milo M. Quaife, The Kingdom of Saint James: A Narrative of the Mormons (New Haven, Yale University Press, 1930), pp. 174-175 and their footnotes. ↩ ↩2 ↩3
-
Northern Islander (St. James, Beaver Island), 9 January 1851. ↩ ↩2
The series, drawn
In the sources
Helen Collar (1911–1995) spent four decades transcribing Beaver Island census returns, parish registers, deeds and death records onto index cards, and recording what islanders told her. Clarke Historical Library publishes that work. It is a researcher's working file — what a record says, what she suspected, and what an informant remembered, often in the same paragraph — so what follows is what the archive holds, not what this archive claims.
Collar wrote a general account of this subject: Emigration and immigrant life. A secondary account in her own words, cited as hers; where she names a source, cite that instead.
Three alphabetical pages (A–C, D–M, O–Z) on the passage and on settling.
Collar wrote a general account of this subject: Census compilation, 1850–1990. A secondary account in her own words, cited as hers; where she names a source, cite that instead.
Alphabetical census pages; the 333-page compilation PDF is held but not yet parsed.
These are Collar's twentieth-century working notes. They preserve the language of her informants and of her period, including racial descriptions of Anishinaabe residents, and they are quoted verbatim because altering a transcription silently would be worse. See the register of dated records for what the parish registers record, and the editorial standards for what this archive will and will not turn a transcription into.
Sources
- A participant shared an external ZIP-code community-profile site using Saint James as an example. The forum records a local research referral, not a demographic dataset or validated population/religion estimate; any such claims require the external source and methodological review.forum · www.beaverislandforum.com · 00 · t000811
- A couple considering a move described a household with three children and two retired military veterans and asked residents about the best and worst aspects of island life. This is prospective-migrant testimony, not evidence of a completed move or a representative quality-of-life survey.forum · www.beaverislandforum.com · 16 · t016314
- A forum participant referred to a new mainland home, and a reply welcomed the person while saying islanders missed them. This is social evidence of a reported move or relocation, not a dated departure record, property transaction, or explanation of why the move occurred.forum · www.beaverislandforum.com · 16 · t016864
- In a joking exchange about bourbon balls, the poster explicitly referred to moving off Beaver Island and near family. This corroborates the poster’s own earlier mainland-home reference as self-reported relocation context, not a dated departure record, property transaction, or population count.forum · www.beaverislandforum.com · 16 · t016915
- The Johnson family advertised a moving sale at 38597 Garden Island View, postponed it because of a snowy driveway and alternate plans to get the family off the island, and later posted a final day with household goods. This is evidence of a household transition and weather/logistics constraint, not a confirmed permanent departure, property sale, or census event.forum · www.beaverislandforum.com · 16 · t016907
- Continuation of the Johnson family moving-sale notice, cited separately for topic-level traceability and not as independent evidence.forum · www.beaverislandforum.com · 16 · t016910
- Described in this archive: Census township population series for Beaver Island, 2000–2020.St. James and Peaine townships together are exactly Beaver Island. 2000 = 551; 2010 = 657; 2020 = 525.demographics · township_population_series
- U.S. Census Bureau published Michigan minor-civil-division and county-subdivision tables, 1900, 1910, 1920, 1950, 1970, and 1990; project-normalized historical extract retrieved 2026-08-02.Described in this archive: Historical Census township population extracts for Beaver Island, 1890–1990.Comparable two-township totals are 792 (1900), 1,065 (1910), 779 (1920), 527 (1930), 521 (1940), 396 (1950), 217 (1960), 219 (1970), 321 (1980), and 404 (1990). The 1890 Peaine count is not summed because St. James was organized from Peaine after 1890. This is a partial printed-series extraction, not a continuous population time series. No public copy of this file is known; the archive holds one and can provide it on request.demographics · historical_census · township_population_1890_1990
- U.S. Census Bureau, *1990 Census of Population and Housing: Population and Housing Unit Counts, Michigan* (CPH-2-24), table 8, p. 19; project-normalized dwelling extract retrieved 2026-08-04.Described in this archive: Historical Census township housing-unit counts for Beaver Island, 1970–1990.Island dwelling totals of 298 (1970), 455 (1980) and 667 (1990), each a sum of the Peaine and St. James rows of one published table. The township rows are 149 and 149 in 1970 — the series records the equality as coincidental — then 231 and 224 in 1980 and 344 and 323 in 1990. The series begins at 1970 because minor civil divisions this small were below the small-area publication threshold of the 1950 and 1960 Censuses of Housing — a publication limit, not an absence of dwellings. No public copy of this file is known; the archive holds one and can provide it on request.demographics · historical_census · township_housing_units_1970_1990
- Described in this archive: Census township housing series for Beaver Island, 2000–2020.Island totals: 741 units / 258 occupied / 463 seasonal-vacant in 2000; 1,016 / 336 / 610 in 2010; 944 / 276 / 598 in 2020. The seasonal-vacancy variable sits at a different position in each vintage (2000 H005005, 2010 H005006, 2020 H5_006N) and each was verified against that vintage's variable list; reading the 2010 position onto 2000 silently returns zero. Township rows: Peaine 410 units in 2000, 564 in 2010, 529 in 2020; St. James 331, 452 and 415.demographics · township_housing_series
- Described in this archive: Beaver Island’s reported winter population reaches approximately 210, 1957.Winter population of approximately 210 as of 1 January 1957 — a newspaper estimate of who was present in January, not a census. The holding institution's portal restricts automated access; the archive holds a copy of this issue and can provide it on request.data1 · beaver-island-archive · beaver_beacon · 1957-01_Beaver-Beacon
- The held four-page issue scan is paired with the OCR source and confirms the published notice or report; it does not expand the source-specific identity, event, or outcome claims.data1 · beaver-island-archive · scans · beaver_beacon · issues · 1957-01_Beaver-Beacon
- Described in this archive: Beaver Island winter census reported by the Beacon, 1962.The Beacon's own winter count of 202 residents in 55 households, offered against a 166 figure attributed to the Grand Rapids Press. A locally compiled enumeration, not an official schedule.data1 · beaver-island-archive · beaver_beacon · 1962-01_Beaver-Beacon
- The held five-page issue scan is paired with the OCR source and confirms the published notice or report; it does not expand the source-specific identity, event, or outcome claims.data1 · beaver-island-archive · scans · beaver_beacon · issues · 1962-01_Beaver-Beacon
- Described in this archive: Beaver Island winter departures reduce the reported population to 170, 1965.A last-census count of 170 reported as households left for the winter. Neither the count's date nor its method is given.data1 · beaver-island-archive · beaver_beacon · 1965-01_Beaver-Beacon
- The held six-page issue scan is paired with the OCR source and confirms the published notice or report; it does not expand the source-specific identity, event, or outcome claims.data1 · beaver-island-archive · scans · beaver_beacon · issues · 1965-01_Beaver-Beacon
- Described in this archive: Beaver Island Housing Market Analysis, 2023.A commissioned market study of housing for permanent residents that explicitly excludes second and vacation homes from its scope. It is evidence that the shortage is being studied locally; it is not a count of dwellings.planning · beaver_island_master_plan · documents · housing-market-analysis-beaver-island-final-draft-september-15-2023-b32f4e6d
- Described in this archive: Helen Collar Census Records transcriptions.A surname-organized transcription compilation derived from federal censuses. It is useful for locating attributed household-level material, but is not an original schedule, independent corroboration of the published totals, or a population time series.web · collar_census
- Described in this archive: St. James Township 1880 census occupational summary, Collar transcription.A separately modeled compiled township snapshot of 30 households and 168 persons. It is not added to the island population series because it does not cover Peaine Township and is not an original census schedule.local_documents · 2006_collar-beaver-island-census-compilation
- Peaine: population 378, median age 66.1, 530 housing units of which 315 vacant. St. James: population 374, median age 59.5, 436 housing units of which 263 vacant.demographics · acs2023_townships
- Described in this archive: The Kingdom of Saint James, Quaife, 1930."A census taken in the autumn of 1854 disclosed 2,608 residents on Big Beaver Island", cited to the *Northern Islander* of 2 November 1854; the estimate that approximately 2,600 were expelled in 1856; and the footnote giving 779 residents in the two townships at the census of 1920.
- *Northern Islander* (Saint James, Beaver Island), early 1851, and the issue of 2 November 1854.Described in this archive: Northern Islander, 1850–1856.Reports the census of 1 June 1850 for Mackinac County as 3,598, "exclusive of Indians", and claims Peaine township then held 300 inhabitants more than the marshal returned. The 1854 island count of 2,608 originates in this paper. No public copy of this file is known; the archive holds one and can provide it on request.
- Project source article: 1850 Federal Census report for Mackinac County.Described in this archive: 1850 Federal Census report for Mackinac County.Normalizes the qualified 3,598 county total and the Peaine undercount claim while preserving that the original schedule is not yet held. No public copy of this file is known; the archive holds one and can provide it on request.kb · articles · documents · census-beaver-island-1850
- Project source article: Strangite census of Beaver Island (1854).Described in this archive: Strangite census of Beaver Island, 1854.Separates the 2,608 figure reported by the *Northern Islander* from an independently verified enumeration. No public copy of this file is known; the archive holds one and can provide it on request.kb · articles · documents · census-beaver-island-1854-strangite
- Described in this archive: Ancient and Modern Michilimackinac, 1854.About two hundred people on Garden Island; five Indian villages in Emmet County totalling about two thousand — populations excluded from the federal count.
- Land Information Access Association, *Beaver Island Master Plan 2023* (adopted 13 November 2023), chapters 1 and 3.Narrative of 20th-century decline, the abandonment of the outer islands, and tourism as the economic anchor from the 1970s. No public copy of this file is known; the archive holds one and can provide it on request.
- Beaver Island Archive, data-quality notes, "Census coverage stops at 2000 for this geography" and "Population is not the same as people present".Records the measurement caveat governing this article: the decennial count and the ACS estimate are different measures, and county-subdivision census data for this geography begins only in 2000. No public copy of this file is known; the archive holds one and can provide it on request.docs · data-quality
- Identifies Michigan state-census years including 1864, 1874, 1884 and 1894. These are a research lead, not yet an ingested population series.
- Retrospective obituary describes the island’s movement from peak fishing and farming, through population loss and mainland departures, toward tourism; it is not a census or measured demographic series.data1 · beaver-island-archive · beaver_beacon · 1972-05_Beaver-Beacon
- The held eight-page issue scan is paired with the OCR source and confirms the published notice or report; it does not expand the source-specific identity, event, or outcome claims.data1 · beaver-island-archive · scans · beaver_beacon · issues · 1972-05_Beaver-Beacon
- Beaver Island Archive, *Population and housing*. CC BY 4.0 for the chart; underlying data public domain (U.S. Census Bureau)The demographic series this article discusses, drawn as one figure: decennial and ACS totals for the island townships. The plate's own note carries the caveat that matters here — the 1850 census excluded Anishinaabe people, so every series begins by omitting the longest-resident population. Credit: Drawn from U.S. Census Bureau decennial and ACS series (public domain). No public copy of this file is known; the archive holds one and can provide it on request.output · population_and_housing
- Annual July 1 estimates for Peaine and St. James townships, retrieved 2026-08-21 by scripts/retrieve_population_estimates.py. Modeled estimates, not counts; no margins of error are published.demographics · township_population_estimates_2018_2025
Added 28 July 2026 · revised 21 August 2026. Recent changes
Cite this article
Beaver Island Archive, “Demography”, https://beaverislandarchive.org/themes/demography/, accessed [date], citing Gillespie, "Interesting Website", Beaver Island Forum, December 2006, topic 811. (and 31 further sources listed on the page).
Last revised 2026-08-21. Fill in [date] with the date you read it — this page is static and cannot know that.